
Financial markets look forward, not backward. Prices change today because investors are constantly updating their expectations about tomorrow: how fast the economy will grow, whether inflation will cool or accelerate, how high interest rates will go, and how much risk businesses and households can handle. Economic indicators are the scoreboard for those expectations. They don’t just describe what happened last month or last quarter—they shape what people believe will happen next. That’s why a single data release can move trillions of dollars in minutes.
But it’s not as simple as “good data makes stocks go up” and “bad data makes stocks go down.” Markets are not grading the economy like a school test. Markets are pricing a path: growth, inflation, and policy. A strong jobs report might lift stocks if it signals healthier demand without overheating wages. The same strong jobs report might crush stocks if it implies inflation will stay sticky and the central bank will keep rates higher for longer. An inflation report that looks “bad” could rally markets if investors were expecting something even worse, or if the details show future inflation pressure easing.
To invest well, you don’t need to become an economist. You need a practical map: which indicators matter most, why they matter, what “surprises” mean, how to avoid misreading headline numbers, and how to translate economic data into smarter decisions about risk, time horizon, diversification, and position sizing.
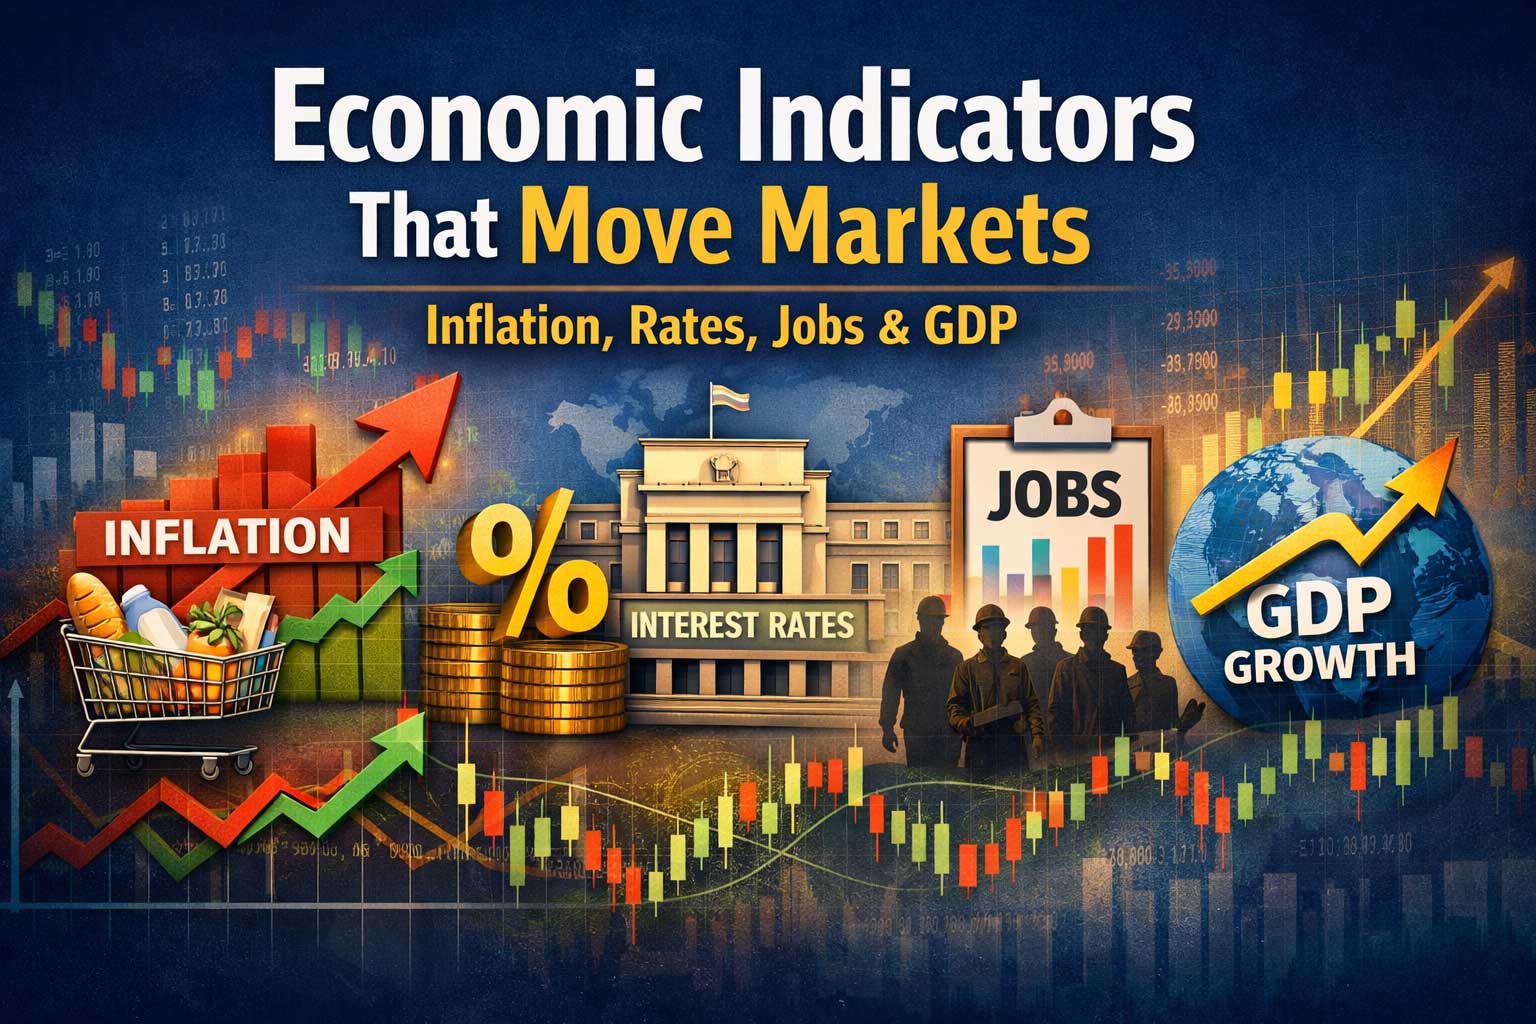
This guide focuses on the core indicators that move markets the most: inflation, interest rates, jobs, and GDP. Along the way, you’ll learn the chain reaction from a data release to market pricing, and how different assets—stocks, bonds, currencies, commodities, real estate, and crypto—tend to respond.
How Economic Data Moves Prices: The Expectations Game
Markets move on the difference between reality and expectations. That difference is called the “surprise.” If inflation prints at 3.2% and everyone expected 3.2%, it may do almost nothing. If it prints at 3.4% or 3.0%, the move can be violent—even though the numbers are close—because markets reprice the future path of interest rates, profits, and risk appetite.
There are three layers to every major economic release:
- The headline number
This is what media and social feeds repeat: CPI, unemployment rate, GDP growth. It drives the initial reaction. - The internals
The details under the headline often matter more: rent inflation, wage growth, labor force participation, revisions, industry breakdowns, inventory changes, export/import impacts. - The policy interpretation
Markets quickly ask: “Does this make the central bank more hawkish or more dovish?” Interest-rate expectations are the bridge between the economy and asset prices.
A useful mental model is this chain:
Economic data → inflation/growth outlook → central bank reaction → interest rates & liquidity → discount rates & earnings outlook → asset prices
Even assets that seem unrelated—like tech stocks or crypto—can be very sensitive to the interest-rate part of the chain because their prices often depend heavily on future growth expectations and liquidity conditions.
The Four Big Forces: Inflation, Rates, Jobs, and GDP
Most indicators fit into one of these categories:
- Inflation: how fast prices are rising
- Rates: the cost of money and the policy response to inflation/growth
- Jobs: the strength of labor markets and wage pressure
- GDP: the broad measure of growth (and how sustainable it is)
Other indicators—retail sales, manufacturing surveys, housing starts, consumer confidence, credit conditions—matter too, but they often move markets because they help predict one of the four forces above.
Inflation: The Indicator That Can Override Everything
Inflation is one of the most market-moving forces because it directly influences central bank policy and interest rates. High inflation can reduce consumers’ purchasing power, squeeze corporate margins, and force central banks to raise rates. Low inflation (or deflation) can signal weak demand and risk of recession, which can also hurt earnings but may bring rate cuts and stimulus.
What Inflation Really Measures
Inflation is the rate at which the overall price level changes over time. It’s not just “prices are high.” It’s “prices are rising quickly.”
Investors care about inflation because:
- It changes the real (inflation-adjusted) return of bonds and cash.
- It affects wage demands and labor costs.
- It influences consumer spending patterns.
- It changes the “discount rate” applied to future earnings, impacting stock valuations.
- It drives central bank decisions, which affect liquidity and risk appetite.
Key Inflation Measures Investors Watch
CPI (Consumer Price Index)
CPI tracks changes in prices for a basket of goods and services paid by consumers. It’s widely followed and often triggers strong market reactions.
- Headline CPI includes everything, including food and energy (which can be volatile).
- Core CPI excludes food and energy to better reflect underlying trends.
Markets often care more about core inflation because central banks want to know whether inflation is entrenched or fading.
PCE (Personal Consumption Expenditures Price Index)
PCE is another consumer inflation measure, often preferred by certain central banks because it can reflect changes in consumption behavior (substitution effects).
PCE also has headline and core versions. Even if CPI is more widely discussed, PCE can be more directly relevant for policy expectations.
Producer Inflation (PPI)
Producer price measures track input costs at earlier stages of the supply chain. Rising producer costs can flow into consumer prices later, though not always. It’s useful as a leading signal but less consistently market-moving than CPI.
Why Inflation Moves Markets So Much
Inflation influences both parts of the stock valuation equation:
- Earnings: Higher inflation can raise costs (wages, materials, interest expense) and can also hurt demand if consumers pull back.
- Valuation: Higher inflation usually leads to higher interest rates, which increases the discount rate, lowering the present value of future earnings.
This is why long-duration assets—where most value comes from earnings far in the future—often react strongly to inflation and rates. Tech and growth stocks frequently fall when inflation surprises higher, not because the companies are suddenly worse, but because the discount rate changes.
The Hidden Details in Inflation Reports
Headline inflation can mislead. The internals often determine how investors interpret the trend.
Here are the details markets tend to focus on:
- Shelter/Housing inflation: Rents and “owners’ equivalent rent” often make up a large share of inflation baskets. Because housing costs move slowly, shelter inflation can keep headline numbers elevated even when other categories cool.
- Services inflation: Services can be “sticky” because they’re tied to wages. If services inflation stays high, it can signal persistent pressure.
- Goods inflation: Goods prices can fall quickly when supply chains normalize. A drop in goods inflation can cool overall inflation without necessarily solving wage-driven pressure.
- Energy and food: volatile but psychologically important; can affect inflation expectations.
- Month-over-month vs year-over-year: YoY can lag; MoM can show turning points earlier, but is noisy. Markets often look at annualized MoM trends in core categories.
- Revisions: A quiet revision can matter as much as the new number. Markets price the updated trend, not just today’s print.
Inflation Expectations: The Second Inflation Indicator
It’s not only actual inflation that matters; it’s what people expect inflation to be.
If businesses and households expect prices to keep rising, they may raise wages and prices preemptively, creating a self-reinforcing cycle. Central banks fear this dynamic.
Investors watch:
- Survey-based inflation expectations (consumer or business sentiment measures)
- Market-based expectations (implied inflation from inflation-linked bonds and nominal bonds)
When expectations rise, central banks may become more aggressive—even if current inflation is moderating—because expectations can become sticky.
How Different Assets React to Inflation
Bonds
Inflation is usually bad for nominal bonds because it erodes real returns and often pushes yields higher (prices lower). Long-term bonds are particularly sensitive because small yield changes cause larger price moves.
Stocks
The reaction depends on whether inflation is seen as growth-driven or cost-driven:
- If inflation rises because demand is strong and companies can raise prices, stocks may hold up.
- If inflation rises because costs surge and consumers struggle, margins shrink and stocks suffer.
Sector behavior often varies:
- Energy and materials can benefit from commodity-driven inflation.
- Consumer staples may be more defensive because demand is steadier.
- Tech and long-duration growth stocks can be sensitive to rate hikes triggered by inflation.
Currencies
Higher inflation can weaken a currency if it reduces purchasing power and damages confidence. But if inflation leads to higher interest rates relative to other countries, the currency can strengthen. Currency moves often come down to rate differentials.
Commodities
Commodities often rise during inflationary periods, especially when inflation is driven by supply constraints. But commodities also depend heavily on global growth.
Real Estate
Real estate can be mixed:
- Inflation can raise replacement costs and rents over time.
- But rising rates can increase mortgage costs and pressure affordability, which can hit prices.
Crypto
Crypto reactions vary by narrative and cycle. In recent market regimes, crypto has often behaved like a high-beta risk asset, sensitive to liquidity and interest-rate expectations.
Interest Rates: The Price of Money and the Market’s Gravity
Interest rates matter because they are the baseline “gravity” for all asset prices. When rates rise, future cash flows are discounted more heavily, borrowing becomes more expensive, and risk-taking often declines. When rates fall, borrowing becomes cheaper, liquidity improves, and investors often bid up risk assets.
Policy Rates vs Market Rates
A major misunderstanding is assuming the central bank rate is the only rate that matters.
There are several important rates:
- Central bank policy rate: short-term benchmark rate
- Government bond yields: market-driven rates across different maturities (2-year, 10-year, 30-year)
- Credit spreads: the extra yield demanded for corporate bonds over safe government bonds
- Mortgage rates: influenced by longer-term yields and credit conditions
Markets often react most strongly to changes in expected future policy and to short- and medium-term yields that reflect policy expectations.
Yield Curve: A Powerful Signal
The yield curve compares yields across maturities. It matters because it reflects expectations of future growth, inflation, and policy.
- Normal curve: longer-term yields higher than short-term yields, often reflecting growth expectations.
- Inverted curve: short-term yields higher than long-term yields, often signaling expectations of slower growth or future rate cuts.
- Steepening: can happen when growth expectations rise or when inflation risk rises, pushing long yields higher.
Markets watch the yield curve because it affects banks (which often borrow short and lend long) and because curve shape can signal recession risk.
Real Rates: The Rate That Hits Valuations Hard
Real rates are interest rates adjusted for inflation expectations. They matter because they reflect the “true” cost of money.
When real rates rise:
- Borrowing becomes more restrictive in real terms.
- Valuations of long-duration assets often fall.
- Risk assets can struggle.
When real rates fall:
- Financial conditions loosen.
- Growth assets often benefit.
In many market cycles, the biggest moves in high-growth stocks and speculative assets correlate closely with real rate changes, not just nominal rates.
Monetary Policy: Why Markets Obsess Over Central Banks
Central banks manage inflation and employment goals using tools like:
- Raising or lowering policy rates
- Adjusting asset purchases or balance sheets (quantitative easing or tightening)
- Communicating forward guidance
Markets react not only to decisions but to tone, language, and projections, because those shape expectations about the path of policy.
A key concept is “higher for longer” versus “cuts coming.” Even when rates don’t move today, the expected path can shift dramatically based on economic data.
Financial Conditions: The Hidden Lever
Rates are not the only channel. Financial conditions include:
- Credit availability
- Corporate bond spreads
- Equity market levels
- Currency strength
- Lending standards
Sometimes central banks look at these broader conditions because they influence the economy as much as the policy rate. If markets rally too aggressively, financial conditions loosen, which can stimulate demand and keep inflation elevated—leading to more tightening later. That’s why markets sometimes fall on “good news” when investors interpret it as triggering tougher policy.
How Different Assets React to Rates
Bonds
Bond prices move inversely to yields. Longer-duration bonds move more for a given yield change. Rate hikes usually pressure bond prices, especially longer maturities.
Stocks
Rising rates often compress valuations. The effect is strongest on companies with:
- High valuation multiples
- Profits expected far in the future
- Heavy reliance on borrowing
But some sectors can benefit from higher rates, at least initially:
- Banks can benefit from higher net interest margins (depending on curve shape and credit quality).
- Insurers can benefit from higher yields on invested premiums.
Currencies
Higher rates can attract capital and strengthen a currency, especially if rate increases are not matched elsewhere. But if higher rates cause recession concerns, it can complicate the reaction.
Real Estate
Higher rates often reduce affordability and can cool housing demand, which can pressure prices.
Crypto and speculative assets
These can be highly sensitive to liquidity conditions and risk appetite tied to rate expectations.
Jobs: The Labor Market as the Engine of Spending and Inflation
Employment data matters because wages drive consumer spending and because wage growth can become a source of persistent inflation. A strong labor market often supports GDP growth and corporate revenues, but it can also keep inflation sticky and force higher rates.
The Jobs Indicators Markets Watch
Nonfarm Payrolls (NFP)
This is one of the most market-moving reports because it gives a snapshot of hiring momentum.
Key elements:
- Jobs added or lost
- Revisions to previous months
- Average hourly earnings (wage growth)
- Labor force participation
- Workweek length (often a subtle signal of demand)
A headline jobs number can be misleading if revisions and wages tell a different story.
Unemployment Rate
The unemployment rate is widely cited but can be tricky. It depends on both:
- the number of people employed
- the number of people looking for work (labor force)
Unemployment can rise for “good” reasons, such as more people entering the labor force, or for “bad” reasons, such as layoffs.
Job Openings and Labor Turnover
Data on job openings, quits, and hires can indicate how tight the labor market is.
- High job openings and high quits can signal strong bargaining power for workers.
- Falling openings can signal cooling demand.
Wage Growth
Wages matter because sustained wage growth above productivity can push services inflation higher. Markets often react strongly when wage growth accelerates unexpectedly.
Why Jobs Data Moves Markets
Jobs data affects:
- Consumer spending (more people working, more income)
- Corporate revenue (demand)
- Inflation (wage-driven services inflation)
- Interest rates (central bank response)
- Credit risk (employment supports loan repayment)
When jobs are strong, recession risk feels lower, which can lift risk assets. But if wages run hot, markets may fear more rate hikes.
The “Goldilocks” Labor Market
Markets love a labor market that is:
- strong enough to support spending and earnings
- cool enough to prevent wage inflation from accelerating
That’s the sweet spot: moderate job gains, stable unemployment, and wage growth consistent with a sustainable inflation target.
Jobs Data and Sector Reactions
- Consumer discretionary can benefit from strong employment if inflation is controlled.
- Financials may benefit from growth but can be hurt if rate hikes increase default risk.
- Defensive sectors often perform better when jobs weaken and recession risk rises.
GDP: The Big Picture of Growth (And Its Traps)
GDP (Gross Domestic Product) is the broadest measure of economic output. It includes everything produced in an economy: consumption, investment, government spending, and net exports.
But GDP is a summary statistic with plenty of hidden traps. It can be revised, distorted by inventories, and influenced by trade flows. Markets care less about GDP as a single number and more about what it implies for growth, profits, and policy.
The GDP Components Investors Need to Know
GDP is often expressed as:
GDP = Consumption + Investment + Government Spending + (Exports − Imports)
Each part tells a different story:
Consumption
Often the biggest part of GDP. Strong consumption supports corporate revenues, especially in consumer-focused sectors.
But investors ask: Is consumption funded by healthy income growth, or by debt and savings drawdowns? Spending can look strong right before it weakens if households are stretching.
Investment
Includes business investment and residential investment (housing). Investment is more cyclical and often leads changes in economic momentum. Rising investment can signal confidence; falling investment can signal caution.
Government Spending
Can support GDP during downturns but may not signal private-sector strength. Markets often interpret government spending differently depending on inflation conditions and deficits.
Net Exports
Exports minus imports can swing GDP. A drop in imports can boost net exports mathematically, but it might also signal weakening domestic demand.
Why GDP Moves Markets Less Than Inflation and Jobs (But Still Matters)
GDP is often released quarterly and revised multiple times. Markets already have many clues by the time GDP arrives: monthly jobs, inflation, retail sales, manufacturing surveys, and more.
However, GDP can still matter when:
- It surprises significantly
- It changes recession probability
- It affects earnings expectations
- It alters policy outlook
Real GDP vs Nominal GDP
- Nominal GDP includes inflation.
- Real GDP adjusts for inflation to show true output growth.
In high-inflation periods, nominal GDP can look strong while real GDP is weak. Markets care about the mix because it affects real purchasing power and profit margins.
The GDP Deflator: Inflation Inside GDP
The GDP deflator is a broad measure of price changes across the economy. It can influence inflation interpretation, especially when CPI and other measures are sending mixed signals.
How the Four Indicators Interact: The Market’s Core Puzzle
Inflation, rates, jobs, and GDP are not separate. They are a system. Understanding the interactions helps you interpret market moves.
Common Regimes and Market Behavior
1) Strong Growth + Falling Inflation (Best Case for Markets)
- GDP solid, jobs healthy
- Inflation cooling
- Rates can stabilize or fall
- Stocks often perform well, risk appetite rises
2) Strong Growth + Rising Inflation (Overheating)
- GDP strong, jobs very tight
- Inflation accelerates
- Rates rise
- Stocks can be choppy; sectors rotate toward value/commodities; bonds often struggle
3) Weak Growth + Falling Inflation (Disinflation / Late Cycle)
- GDP slowing, jobs cooling
- Inflation falls
- Rates may fall
- Bonds often perform well; stocks can do okay if rate cuts support valuations, but earnings risk rises
4) Weak Growth + Rising Inflation (Stagflation Risk)
- GDP weak, jobs weakening
- Inflation stays high
- Rates may remain high
- Both stocks and bonds can struggle; defensive and real assets sometimes outperform
Markets are constantly trying to identify which regime is forming.
Practical Guide to Reading Major Releases Like a Pro
Step 1: Check Expectations, Not Just the Number
If the market expects inflation to cool and it doesn’t, that’s a negative surprise even if inflation is “lower than last year.”
Step 2: Look at the Trend
One month can be noise. Markets care about 3- and 6-month annualized trends in core categories.
Step 3: Inspect the Internals
Shelter, services, wages, participation, revisions—these often decide whether the data truly changes the macro story.
Step 4: Watch Rates and the Currency Reaction
The cleanest way to see how markets interpret a release is to watch how bond yields and the currency move immediately afterward. Those moves reflect updated expectations for policy and growth.
Step 5: Separate Short-Term Volatility From Long-Term Investing
Many releases create short-term swings that reverse quickly. Long-term investors should use data to adjust risk and diversification, not to chase every move.
The Secondary Indicators That Often Move Markets Through the Big Four
While inflation, rates, jobs, and GDP dominate, several other indicators can move markets because they provide early signals.
Retail Sales
A key indicator of consumption strength. Strong retail sales can boost growth expectations but may also raise inflation concerns.
PMI Surveys (Manufacturing and Services)
Purchasing Managers’ Index surveys provide early insight into activity levels, new orders, and pricing pressures. They can hint at GDP direction.
Housing Data
Housing is rate-sensitive and can lead the broader economy. Data like housing starts, permits, and home sales can signal whether rates are biting.
Consumer Confidence and Sentiment
Confidence can affect spending. More importantly, some surveys include inflation expectations, which can influence policy outlook.
Credit Conditions and Lending Standards
When banks tighten lending, growth often slows later. Credit is a powerful transmission mechanism.
How to Invest Using Economic Indicators Without Turning Into a Day Trader
You can respect economic indicators without letting them control your emotions.
1) Build a Portfolio That Can Survive Multiple Regimes
Because you can’t perfectly predict which regime will dominate, diversify across assets and styles:
- Growth and value exposure
- Some inflation resilience (depending on your risk profile)
- Quality companies with strong balance sheets
- Bonds aligned with your time horizon
- Cash or short-term instruments as a volatility buffer when rates are high
2) Use Economic Data to Adjust Risk, Not to Predict the Next Candle
Indicators are best used to answer:
- Should I be more aggressive or more defensive?
- Is my portfolio too concentrated in rate-sensitive assets?
- Do I need more diversification across sectors or geographies?
- Is my bond duration aligned with my risk tolerance?
3) Focus on Quality During Tightening Cycles
When rates rise and credit tightens, weaker business models often struggle most. Companies with:
- strong cash flow
- low debt
- pricing power
- resilient demand
tend to fare better.
4) Don’t Confuse Disinflation With “Everything Is Safe”
Inflation falling can be good, but if it’s falling because demand is collapsing, earnings may drop. Markets often rally on early disinflation and then face reality if recession hits.
5) Use Dollar-Cost Averaging to Reduce Timing Risk
If you invest consistently, economic volatility becomes less threatening. You buy more when prices are lower and less when prices are higher, reducing the need to predict data surprises.
6) Rebalance With Discipline
Economic cycles create winners and losers. Rebalancing forces you to trim what ran up and add to what fell, which can improve risk-adjusted returns over time.
Common Mistakes Investors Make With Economic Indicators
Mistake 1: Reacting to Headlines Without Context
A “hot” inflation print might be driven by one category that is likely to reverse, while underlying inflation cools. Or a “weak” jobs report might hide strong hiring in key sectors.
Mistake 2: Ignoring Revisions
Some reports get revised substantially. The trend matters more than the first print.
Mistake 3: Thinking Markets Are “Wrong”
Markets can fall on good data and rise on bad data because prices move relative to expectations and policy implications.
Mistake 4: Overfitting Your Portfolio to One Macro View
If you position your entire portfolio for one outcome (soft landing, recession, stagflation), you may be wrong longer than you can stay comfortable. Build resilience first.
Mistake 5: Treating GDP Like a Monthly Trigger
GDP is often old news by the time it’s released. Use it for confirmation and regime awareness, not constant trading.
Putting It All Together: A Simple Framework You Can Reuse
Here’s a practical checklist you can apply to any major economic release:
- What did the market expect?
- What was the surprise (direction and magnitude)?
- Do the internals confirm or contradict the headline?
- Does this change the inflation trend?
- Does this change the growth trend?
- How does this change expected central bank policy?
- How did bond yields react?
- How did the currency react?
- Which sectors/assets are most sensitive to this change?
- Does this require a portfolio change, or just emotional discipline?
Most of the time, the right answer for long-term investors is: keep your plan, rebalance, and manage risk. But the framework helps you stay rational during volatility and prevents you from reacting to noise.
A Deeper Look: Why the Same Data Can Move Markets in Opposite Directions
To truly understand market reactions, you need to understand that markets don’t have one objective. They are balancing multiple fears and hopes:
- Fear of inflation persistence
- Fear of recession
- Hope for stable growth
- Hope for rate cuts or easing
- Fear of credit events
- Hope for earnings expansion
A strong jobs report can be:
- bullish for earnings (more spending)
- bearish for rates (more tightening)
A weak inflation report can be:
- bullish for rates (cuts sooner)
- bearish for growth if it suggests demand weakness
So markets ask: Which force dominates right now?
That dominant force can change over time.
Early in an inflation fight, markets may be obsessed with inflation prints. Later, when inflation cools, markets may shift focus to jobs and GDP for recession risk. The same indicator becomes more or less powerful depending on the regime.
Long-Term Investor Takeaways
Economic indicators are not a prediction machine. They are a navigation system. They tell you whether the economy is accelerating or slowing, whether inflation pressure is building or easing, and how central banks might respond. If you can interpret them through the lens of expectations and policy, you’ll stop being surprised by confusing market moves.
Inflation tells you whether purchasing power is shrinking and whether policy is likely to tighten or ease. Interest rates tell you the cost of money and the valuation framework markets use. Jobs tell you whether consumers can keep spending and whether wage-driven inflation might persist. GDP tells you the big picture of growth and whether the economy is expanding in a healthy way.
When you combine these signals with disciplined investing—diversification, consistent contributions, risk management, and rebalancing—you don’t need to fear economic headlines. You use them to stay grounded, avoid emotional decisions, and keep your portfolio aligned with the reality that markets are always shifting—but a solid plan can outlast every cycle.