
Market prices move for two big reasons: what people believe will happen next, and how urgently they feel they must act on that belief. Fundamentals shape long-term outcomes, but emotions often shape the path prices take to get there. That’s why market sentiment matters. Sentiment is the “temperature” of a market—how optimistic, fearful, confident, or stressed participants feel right now. And in the short to medium term, that temperature can dramatically affect returns, volatility, and the kinds of opportunities investors see.
Market sentiment indicators exist because investors wanted a way to measure the unmeasurable. Fear and greed are human states, but markets leave footprints. Those footprints appear in option prices, put/call activity, credit spreads, momentum, breadth, flows, and positioning. When you combine these clues, you can estimate whether the crowd is complacent, panicked, euphoric, or uncertain.
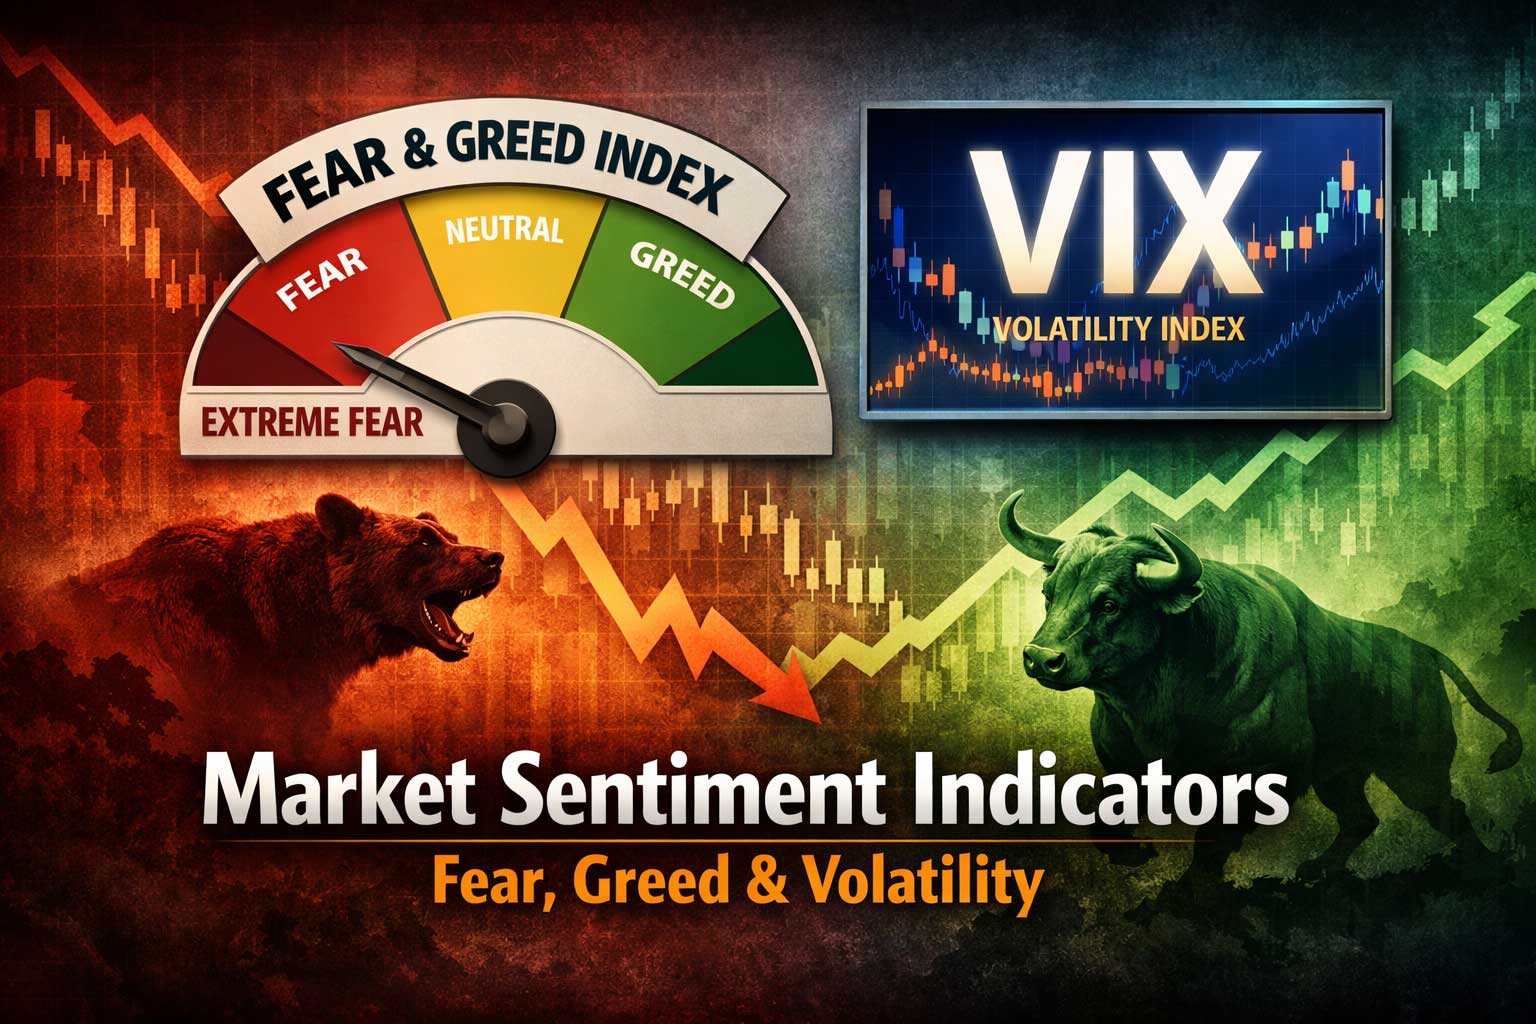
Two of the most talked-about sentiment tools are:
- The Fear & Greed Index, a composite that tries to summarize multiple signals into one easy gauge.
- The VIX, often called the market’s “fear gauge,” derived from option prices and focused on expected volatility.
These tools are popular because they’re intuitive. When fear is high, markets often feel unsafe. When greed is high, markets often feel unstoppable. And the VIX spikes when uncertainty surges. But here’s the important truth: sentiment indicators don’t predict the future in a simple “up or down tomorrow” way. They measure conditions—and conditions influence probabilities, not certainties.
This article will explain what these indicators actually mean, what they don’t mean, and how to use them responsibly as part of a real investing process.
What Market Sentiment Really Is
Before discussing indicators, it’s crucial to understand what sentiment is and what it isn’t.
Sentiment is a snapshot of collective psychology
Market sentiment is the aggregate emotional and behavioral stance of investors—whether they’re optimistic, fearful, confident, stressed, or indifferent. It’s not one person’s feelings. It’s the crowd’s posture, expressed through real decisions: buying, selling, hedging, and taking risk.
Sentiment affects prices through urgency
Two investors can have the same belief (“this stock is expensive”), but one might do nothing while the other rushes to sell. Sentiment is the difference between “I think” and “I must act.”
- Fear makes people demand safety right now. They sell risky assets, buy insurance (options), and pay up for bonds or defensive holdings.
- Greed makes people chase returns. They borrow, concentrate, ignore risk, and assume good outcomes continue.
Sentiment is not the same as fundamentals
A company can be strong while the market hates it, or weak while the market loves it. In the short term, price is driven by flows, narratives, and positioning. In the long term, fundamentals tend to pull prices back toward reality.
Sentiment is often mean-reverting—but not always quickly
A key reason sentiment indicators are useful is that extreme emotion tends to fade. Panic rarely lasts forever. Euphoria eventually meets limits. But “eventually” could be days, months, or longer. Sentiment can remain extreme while prices continue moving in the same direction.
This is why sentiment is best used as a risk management and timing context tool, not as a standalone trading signal.
Why Sentiment Indicators Exist
If sentiment is so important, why not just look at headlines or social media? Because subjective feelings are noisy. Investors wanted more objective signals.
Sentiment indicators try to answer questions like:
- Are investors paying unusually high prices for downside protection?
- Is the market rising because many stocks are participating or only a few?
- Are investors rushing into risky assets or hiding in safe assets?
- Are options traders positioning for extreme outcomes?
- Is volatility expected to rise, and if so, how much?
The goal isn’t to label the market as “good” or “bad.” The goal is to understand whether market conditions are calm, stressed, overheated, or fragile.
The Fear & Greed Index: What It Measures
The Fear & Greed Index is famous because it’s simple. It typically displays a score from 0 to 100:
- 0–24: Extreme Fear
- 25–44: Fear
- 45–55: Neutral
- 56–75: Greed
- 76–100: Extreme Greed
The idea is straightforward: when fear is extreme, people may be dumping assets irrationally, creating potential bargains. When greed is extreme, people may be ignoring risk, creating vulnerability.
The key concept: it’s a composite of different signals
The Fear & Greed Index isn’t a single metric like price. It combines multiple indicators, each intended to capture an aspect of sentiment. Depending on the provider, the exact mix can vary, but common components include:
- Stock price momentum (e.g., whether a major index is above its moving average)
- Market breadth (how many stocks are rising vs falling)
- Strength of price gains vs losses (volume in advancing vs declining stocks)
- Put/call ratios (more puts suggests fear; more calls suggests optimism)
- Volatility measures (like the VIX itself)
- Safe-haven demand (how bonds perform relative to stocks)
- Junk bond demand / credit spreads (risk appetite in credit markets)
- Market volatility trends (short-term vs longer-term volatility)
By mixing these, the index tries to avoid being fooled by one distorted signal. For example, a market might rise on strong momentum, but if credit spreads widen and volatility rises, the index may not show “extreme greed.”
What it’s really telling you
A high Fear & Greed reading generally means:
- Prices have been rising strongly
- Investors are less willing to pay for protection
- Risky assets are being favored
- Breadth and momentum are supportive
- Volatility is subdued or falling
A low reading generally means:
- Prices have been falling or chopping
- Investors are buying protection aggressively
- Safe assets are favored
- Breadth is weak
- Volatility is elevated or rising
The biggest misunderstanding
Many people assume:
- Extreme fear = buy immediately
- Extreme greed = sell immediately
That’s not how it works. Extremes are conditions. They suggest heightened probability of reversal or fragility, but timing is not guaranteed. A market can remain fearful and continue falling, or remain greedy and keep rising.
The Fear & Greed Index is best used as a context indicator, especially when combined with price trends and risk controls.
The VIX: What It Really Measures
The VIX is one of the most misunderstood indicators in finance. People call it the “fear index,” but it isn’t measuring fear directly. It measures the market’s expectation of volatility over the next ~30 days, based on option prices.
Volatility is not the same as direction
A high VIX doesn’t guarantee the market will fall tomorrow. It suggests the market expects bigger moves—up or down—than usual. That said, volatility tends to rise when markets fall sharply because fear increases demand for downside protection, and option prices rise.
So the VIX is often negatively correlated with stock prices, but it’s not a perfect inverse indicator.
Why option prices matter
Options are basically insurance contracts. If many investors want protection against a crash, they buy put options. When demand for puts rises, put prices rise. Since implied volatility is a key input in option pricing, implied volatility rises too.
The VIX aggregates implied volatility information across a range of option strikes and maturities, turning it into a single number.
How to interpret VIX levels
There’s no magical “good” or “bad” number, but typical interpretations include:
- VIX below ~15: Market is calm, confident, sometimes complacent
- VIX ~15–25: Normal uncertainty, typical fluctuations
- VIX above ~25: Elevated stress, risk-off behavior, fear building
- VIX above ~35–40: Panic-like conditions, forced selling and liquidity concerns often present
These are rough guidelines. The meaning depends on context: the economic cycle, inflation regime, monetary policy, and what’s happening in markets.
The most important thing: VIX is forward-looking expectation
The VIX reflects what option traders are pricing in for near-term volatility. That’s why it’s valuable. It’s not a lagging measure like “volatility that already happened.” It’s about expected volatility.
However, expected volatility can be wrong. Markets misprice risk all the time. The value of the VIX is not that it is always correct; it’s that it reveals what the market collectively is willing to pay for insurance.
Fear vs Volatility: The Difference That Matters
It’s tempting to equate fear with volatility, but they’re different.
- Fear is emotional urgency to avoid loss.
- Volatility is the size of price swings.
Fear often increases volatility, but volatility can rise without fear. For example:
- A major earnings event can increase volatility expectation even if sentiment is optimistic.
- A surprise policy announcement can increase volatility because outcomes are uncertain, not because investors are panicking.
- In a speculative bubble, volatility can rise as prices move wildly upward—greed-driven volatility.
So when you see the VIX rising, you should ask: Is this fear-based hedging, uncertainty-based repricing, or simply a shift in expected market movement?
The Core Mechanics Behind Sentiment Indicators
To use sentiment tools intelligently, it helps to understand the machinery underneath. Most sentiment indicators are built from a few categories of market behavior.
1) Price-based signals (momentum and trend)
Markets trend because investors anchor to recent performance. Rising prices create confidence; falling prices create fear.
- When price is above a long-term moving average, sentiment tends to be stronger.
- When price breaks below key support levels, sentiment often deteriorates quickly.
Trend is not sentiment, but trend strongly influences sentiment.
2) Breadth signals (participation)
Breadth asks: are many stocks participating, or only a few?
- Strong breadth suggests broad confidence and healthier price action.
- Weak breadth can indicate fragility, even if an index is rising.
A market lifted by a handful of large stocks often becomes more vulnerable to shocks.
3) Options signals (insurance demand)
Options are where fear and greed often show most clearly.
- Rising demand for puts suggests fear and hedging.
- A heavy call-buying environment suggests optimism or speculation.
But options markets are complex: sometimes institutions buy puts as routine hedges, or sell puts as yield strategies. Interpretation requires context.
4) Credit signals (risk appetite)
Credit markets can be more sober than equity markets. When investors demand higher yields to hold lower-quality bonds, it indicates rising risk aversion.
Widening credit spreads can be a warning that fear is spreading beyond stocks.
5) Flow and positioning signals (what investors are actually doing)
Surveys capture what people say. Flows and positioning capture what people do.
- Large inflows to stocks can indicate optimism.
- Large inflows to money markets can indicate caution.
- Extreme positioning can make markets fragile because there may be fewer marginal buyers left.
How Fear & Greed and VIX Relate (But Aren’t the Same)
It’s common to see a Fear & Greed Index reading and a VIX level and assume they should always match. They often do, but not always.
When they align
- During a sharp sell-off, VIX rises and Fear & Greed falls.
- During a steady rally, VIX falls and Fear & Greed rises.
When they diverge
- The market can rally while VIX stays elevated if uncertainty remains high.
- The market can drift sideways while Fear & Greed moves toward greed if breadth and momentum improve.
- VIX can rise ahead of major events (policy meetings, elections, earnings seasons) even if fear is not extreme.
Divergences can be informative. They often signal a market that is conflicted: prices may be stable, but demand for protection is rising. That can hint at hidden fragility.
What Sentiment Extremes Usually Mean in Practice
Sentiment indicators are most useful at extremes, but you need to know what extremes typically reflect.
Extreme fear: what’s happening underneath
When fear is extreme, several things are often happening:
- Investors sell quickly to stop emotional pain
- Leveraged positions unwind
- Margin calls and forced liquidation may occur
- Volatility spikes
- Bid/ask spreads widen
- Correlations rise (everything sells off together)
- News feels overwhelmingly negative
In these moments, markets often overshoot. Prices can move below reasonable estimates of value. That’s why extreme fear is often associated with good long-term entry points—if you can survive the short-term turbulence.
Extreme greed: what’s happening underneath
When greed is extreme:
- Investors chase recent winners
- Risk controls loosen
- Valuation discipline fades
- “This time is different” narratives spread
- Volatility may compress
- Leverage and concentration often increase
This environment can persist longer than many expect. Greed can fuel trends. But it also increases vulnerability: when everyone is already positioned bullishly, there may be fewer buyers left to keep pushing prices higher.
The Most Common Mistakes People Make With These Indicators
Mistake 1: Using sentiment as a standalone buy/sell trigger
Sentiment is context, not a complete strategy. If you buy every time fear is high without considering trend and risk, you can catch falling knives. If you sell every time greed is high, you can miss long bull runs.
Mistake 2: Thinking “VIX up means market down tomorrow”
VIX measures expected volatility, not guaranteed decline. The market can rise with VIX elevated, especially during uncertain rebounds.
Mistake 3: Ignoring regime changes
A VIX of 20 might be “high” in a calm regime and “low” in a crisis regime. Context matters.
Mistake 4: Confusing noise with signal
Sentiment can swing daily. Not every swing matters. If you react to every tick, you end up overtrading.
Mistake 5: Assuming the crowd is always wrong
Contrarian investing is popular: buy when others are fearful, sell when others are greedy. That idea can work, but only at extremes, and only with proper risk management. Sometimes the crowd is right—fear can be rational when fundamentals are deteriorating.
A Practical Framework for Using Sentiment Indicators
To make sentiment useful, you need a framework. Here’s a strong way to think about it:
Step 1: Identify the market trend
Ask: is the market in an uptrend, downtrend, or range?
- In an uptrend, fear spikes can be buying opportunities.
- In a downtrend, greed spikes can be selling opportunities.
- In a range, sentiment extremes can help with timing, but false signals are common.
Trend doesn’t guarantee outcomes, but it shapes the odds.
Step 2: Use sentiment to adjust aggressiveness, not direction
Instead of “buy or sell,” think “how aggressively should I act?”
- Extreme fear in an uptrend might mean: add exposure, rebalance into risk, increase buying speed.
- Extreme greed in an uptrend might mean: rebalance, tighten risk, reduce leverage, take partial profits.
- Extreme fear in a downtrend might mean: avoid panic selling, protect capital, wait for stabilization.
- Extreme greed in a downtrend might mean: be cautious about “bear market rallies.”
Step 3: Match actions to your time horizon
Sentiment indicators are most powerful when aligned with horizon:
- Long-term investors: Use fear extremes to rebalance and deploy cash gradually.
- Medium-term investors: Use sentiment extremes as timing filters combined with trend and breadth.
- Short-term traders: Use VIX dynamics and options signals, but risk is high and timing is critical.
Step 4: Build rules that prevent emotional decisions
The best use of sentiment is to create a plan that keeps you rational.
Example rule set:
- When Fear & Greed is extreme fear, invest a scheduled amount weekly for 6–12 weeks rather than all at once.
- When Fear & Greed is extreme greed, rebalance back to target allocations and reduce concentrated positions.
- When VIX spikes above a stress threshold, avoid increasing leverage and consider hedging or reducing risk exposure.
- When VIX collapses to very low levels, avoid assuming markets are “safe.” Consider that complacency can precede sudden volatility.
Rules turn sentiment from entertainment into discipline.
Deep Dive: Why the VIX Spikes So Fast
Many investors are surprised by how quickly the VIX can rise. That speed comes from the structure of markets.
1) Options demand accelerates in fear
When markets fall, investors rush to buy protection. Demand jumps, so implied volatility jumps.
2) Dealers hedge by selling stocks
Option dealers often hedge their exposure dynamically. When demand for puts rises, dealers may need to sell underlying stocks to stay hedged. That can amplify downward moves, which increases volatility, which increases option demand—a feedback loop.
3) Volatility clustering
Volatility tends to cluster: calm periods are followed by calm periods, and volatile periods are followed by volatile periods. When a shock hits, the market starts pricing in more aftershocks.
4) Liquidity shrinks under stress
When liquidity is thin, prices move more per unit of trading. That increases realized volatility, which feeds into implied volatility.
This is why VIX spikes are often sharp and dramatic: they reflect sudden changes in demand for insurance and the structural hedging that follows.
Deep Dive: Why the VIX Can Stay High Even as Markets Recover
A market can bounce while VIX remains elevated. This confuses people. Here’s why it happens.
1) Uncertainty remains
A bounce doesn’t eliminate uncertainty. Investors may still fear another drop, so they keep hedges on.
2) Volatility can be high in both directions
Recoveries after sell-offs often include big up days and big down days. That means volatility remains high.
3) Options pricing reflects future risk, not yesterday’s price
Even if prices recover, the market might still price the next month as risky due to upcoming events, fragile sentiment, or uncertain economic conditions.
A high VIX during a rebound often signals: “We’re not convinced this is over.”
Sentiment Indicators and Real-Life Investor Behavior
Sentiment tools matter because they reflect human bias. Understanding those biases helps you interpret what the indicators are signaling.
Loss aversion
People feel losses more strongly than gains. That’s why fear-driven selling can be intense and fast.
Recency bias
People overweight recent events. After a rally, investors expect rallies. After a drop, investors expect drops.
Herd behavior
People take cues from others. If everyone is selling, selling feels “safe,” even if it locks in losses.
Confirmation bias
Investors seek information that supports what they already believe. During fear, negative news dominates attention.
Sentiment indicators capture the output of these biases. If you understand the psychology, you understand why extremes occur.
How to Combine Fear & Greed With the VIX for Better Insight
A simple way to gain clarity is to look at both together and interpret the combination.
Scenario A: Fear & Greed is fearful and VIX is high
This usually indicates broad stress. Risks are elevated, but opportunity may be forming—especially if panic looks overdone.
Best use: cautious buying plans, rebalancing, dollar-cost averaging, avoid emotional selling.
Scenario B: Fear & Greed is greedy and VIX is low
This usually indicates confidence or complacency. Trend may be positive, but risk can build under the surface.
Best use: rebalance, tighten risk, avoid leverage, avoid chasing.
Scenario C: Fear & Greed is greedy but VIX is rising
This can signal a market that looks optimistic on the surface but is quietly paying up for insurance.
Best use: treat as a caution sign; reduce concentration, consider protective strategies, watch for trend breaks.
Scenario D: Fear & Greed is fearful but VIX is falling
This can signal stabilization. Fear remains in narratives, but the market is pricing less future turbulence.
Best use: look for confirmation via breadth and price action; opportunities may be emerging.
The “Contrarian” Idea: When It Works and When It Fails
“Be greedy when others are fearful and fearful when others are greedy” is popular because it sounds wise and often is—but only under certain conditions.
When contrarian works best
- Fear is driven by emotional selling rather than permanent impairment
- Liquidity events cause overshooting
- Valuations become unusually attractive
- Sentiment is truly extreme across multiple measures
When contrarian fails
- Fundamentals are deteriorating for real reasons
- A structural regime shift is happening (credit crisis, deep recession, policy shock)
- The market is repricing long-term expectations, not just panicking
- You act too early without risk controls
Contrarian thinking is powerful, but timing risk is real. The best contrarian approaches usually involve staged entries and risk management, not all-in decisions.
Sentiment and Long-Term Investing: How to Use It Without Overtrading
Long-term investors often ask: “Should I even care about sentiment?” Yes, but in a very specific way.
Sentiment is a rebalancing tool
If your plan has target allocations (like 60/40, 80/20, or a diversified portfolio), sentiment can guide when to rebalance more actively.
- When fear is extreme and stocks are down, rebalancing forces you to buy what has fallen.
- When greed is extreme and stocks are up, rebalancing forces you to trim what has risen.
This is disciplined behavior. It turns sentiment extremes into a mechanical advantage.
Sentiment helps you avoid behavioral mistakes
During fear, investors sell at lows.
During greed, investors buy tops.
If sentiment indicators remind you “this is extreme,” you’re less likely to do the worst possible thing at the worst possible time.
Sentiment supports deployment of cash
If you hold cash for opportunities, sentiment extremes can guide how quickly to deploy:
- Neutral sentiment: normal pace
- Extreme fear: faster deployment, but in stages
- Extreme greed: slower deployment, prioritize diversification and quality
Sentiment and Risk Management: The Most Valuable Use
If there’s one best use of sentiment indicators, it’s risk management.
When markets are complacent
Complacency doesn’t mean “sell everything.” It means:
- Avoid excessive leverage
- Avoid concentration in the hottest trades
- Make sure emergency cash is intact
- Re-check position sizing
- Ensure you can survive a volatility spike
When markets are panicked
Panic doesn’t mean “buy everything.” It means:
- Avoid emotional decisions
- Reduce forced selling risk (don’t use margin you can’t sustain)
- Plan staged buying if your horizon is long enough
- Focus on quality and diversification
- Protect against catastrophic outcomes
Sentiment should push you toward stability, not impulsiveness.
What “They Really Mean” in Plain English
Let’s translate these indicators into everyday meaning.
Fear & Greed Index in plain English
It’s a crowd mood dashboard based on multiple market clues. It tells you whether markets are acting like:
- “Everything is dangerous, get me out” (fear)
- “Everything is safe, I need in” (greed)
But it doesn’t tell you when the mood will change. It tells you how intense the mood is today.
VIX in plain English
It’s the price of insurance for the stock market, converted into a volatility estimate. It tells you:
- How expensive downside protection is
- How uncertain markets feel about near-term moves
- Whether traders are expecting turbulence
High VIX means insurance is pricey and turbulence is expected. Low VIX means insurance is cheap and markets expect calm.
A Realistic “How to Use This” Checklist
Here’s a practical checklist you can apply without turning sentiment into a guessing game.
If Fear & Greed is extreme fear
- Stick to your plan; don’t panic sell
- If you’re a long-term investor, consider staged buying
- Rebalance if your stock allocation fell below target
- Avoid leverage and forced liquidations
- Prefer quality diversification over speculative bets
If Fear & Greed is extreme greed
- Rebalance if stocks grew above target
- Reduce concentration risk
- Tighten position sizing rules
- Avoid chasing recent winners with new money
- Keep some liquidity for future opportunities
If VIX is rising sharply
- Expect wider price swings and emotional markets
- Check whether your portfolio risk is appropriate
- Avoid making big bets based on one headline
- Consider whether you need hedges or simply less exposure
If VIX is unusually low
- Don’t assume “safe”
- Beware of crowded trades and leverage
- Ensure your plan can handle a volatility surprise
- Keep discipline: diversification, sizing, and time horizon
The Bottom Line: Sentiment is a Tool, Not a Crystal Ball
Market sentiment indicators are powerful because they reveal something fundamental: investing is not just math, it’s psychology. The Fear & Greed Index and the VIX don’t tell you “what will happen.” They tell you what the market feels and what the market is willing to pay to protect itself.
Used correctly, these indicators can:
- Improve timing around rebalancing
- Reduce emotional decision-making
- Highlight fragility during complacency
- Highlight opportunity during panic
- Provide a risk context for portfolio adjustments
Used incorrectly, they can:
- Encourage overtrading
- Create false certainty
- Lead you to fight trends without protection
- Push you into “all-in” decisions at the wrong time
The most professional approach is simple: treat sentiment as a risk and behavior guide. Let it help you stay disciplined when emotions run hot—because the moments when fear and greed are loudest are often the moments when your plan matters most.